(With Profound Consulting’s Case Study)

In the fast-paced world of business, cash isn’t just king; it’s the oxygen that keeps everything alive. But simply having cash isn’t enough. How quickly you can turn your investments in inventory and other resources back into cash in your bank account is a critical measure of your operational efficiency and financial health. This is where the Cash-to-Cash Cycle Time (CCCT) comes into play.
Understanding and optimizing your CCCT can free up significant working capital, reduce your reliance on external financing, and ultimately boost your profitability. Let’s dive in!
What Exactly is the Cash-to-Cash Cycle Time?
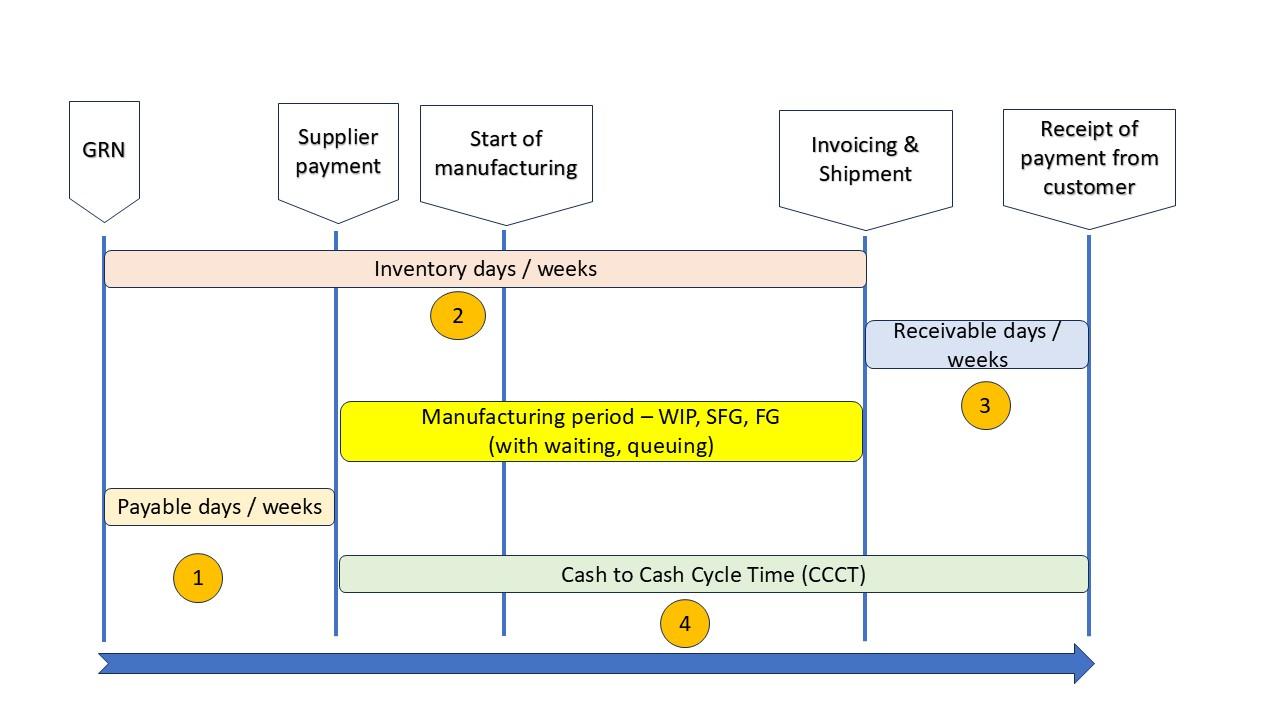
The Cash-to-Cash Cycle Time (also known as the Cash Conversion Cycle) measures the number of days it takes for a company to convert its investments in inventory and other resources into cash flows from sales.
In simpler terms, it’s the time lag between when you pay out cash for raw materials/inventory and when you receive cash from your customers for the finished products or services. The shorter this cycle, the better, as it means your cash is working harder for you and isn’t tied up unnecessarily.
Breaking Down the Components of CCCT
The CCCT is calculated using three key operational metrics:
Inventory Days:
• What it is: The average number of days it takes to sell your entire inventory.
• Formula: (Average Inventory / Cost of Goods Sold) * Number of Days in Period
• Lower Inventory days is generally better, indicating efficient inventory management.
Receivable Days:
• What it is: The average number of days it takes to collect payment from your customers after a sale has been made.
• Formula: (Average Accounts Receivable / Total Sales) * Number of Days in Period
• Lower Receivable days is better, indicating faster collection of receivables.
Payable Days:
• What it is: The average number of days it takes for your company to pay its suppliers.
• Formula: (Average Accounts Payable / Cost of Goods Sold) * Number of Days in Period
• Higher Payable days (within reasonable limits and good supplier relations) is generally better from a cash flow perspective, as it means you’re holding onto your cash longer.
The Cash-to-Cash Cycle Time Formula:
Once you have these three components, the CCCT formula is straightforward:
CCCT = Inventory Days + Receivable Days – Payable Days
Case Study from one of Profound Consulting’s implementation – an Industrial & Automotive products manufacturer
BEFORE SCENARIO (365 days) in INR – (Before implementing solutions):
• Average Inventory: 314 mn
• Cost of Goods Sold (COGS)/ Truly Variable Cost (TVC): 792 mn
• Average Accounts Receivable: 332 mn
• Total Sales : 1200 mn
• Average Accounts Payable: 183 mn
Now, let’s calculate each component:
• Inventory Weeks:
• (314 / 792) * 52
~ 21 weeks
• Receivable Weeks (considering gst):
• (332 / 1200) * 52
~ 14 weeks
• Payable Weeks:
• (183 / 792) * 52
~12 weeks
The Cash to Cash Cycle Time:
• CCCT = Inventory Weeks + Receivable Weeks – Payable Weeks
• CCCT = 21 + 14 – 12 weeks
• CCCT = 23 weeks
This means it took approximately 23 weeks to convert its initial cash outlay for inventory back into cash received from customers.
Why Does CCCT Matter So Much?
A shorter CCCT cycle offers numerous benefits:
• Improved Liquidity: Less cash is tied up in operations, meaning more cash is available for investments, debt repayment, or handling unexpected expenses.
• Reduced Working Capital Needs: You need less external financing (like loans or lines of credit) to fund your day-to-day operations.
• Increased Profitability: Lower financing costs (interest on loans) can directly improve your bottom line.
• Greater Efficiency: It’s a strong indicator of how well your inventory management, sales collection, and payables processes are working.
• Competitive Edge: Companies with shorter CCCT are often more agile, antifragile and financially resilient.
The traditional goal is also simple: make this number as small as possible. A lower CCCT means your cash is working for you, not sitting idle in inventory or waiting in a customer’s bank account.
But what if I told you that focusing solely on shrinking the CCCT number is like trying to win a race by staring at the stopwatch instead of the track?
Instead of obsessing over a lagging indicator like CCCT, I encourage you to focus on the flow that generates cash. It shifts the focus from cycle time to cash velocity the leading indicator.
It isn’t about just making a time cycle shorter; it’s about making the entire system faster and more productive. It’s about increasing Cash Velocity.
Think of it this way: CCCT is like measuring a car’s lap time. Cash Velocity is like measuring its average speed around the entire track. A faster speed naturally results in a shorter lap time, but focusing on speed forces you to improve the engine, the aerodynamics, and the driver’s skill—the things that actually matter.
So, how do we measure Cash Velocity? A powerful, simple formula is:
Cash Velocity = (Sales / Cost of Goods sold (TVC))^(1/CCCT)-1)
This metric tells you how many times a Rupee invested in inventory was converted into pure Throughput (money in the bank):
- You want to increase Throughput
- You want to decrease Inventory
- You want to reduce CCCT
A higher Cash Velocity number means your system is becoming more efficient, more productive, and more profitable at its core.
How to Increase Your Cash Velocity: The 5 Focusing Steps
A practical, repeatable process for improving any system, including your cash flow system. It’s called the Five Focusing Steps.
- IDENTIFY the Constraint: Find the single biggest bottleneck that is limiting your ability to generate more Throughput. Is it lack of demand? Is it a machine on the shop floor? The sales quoting process? The invoicing department? Where is the flow of cash getting stuck?
- EXPLOIT the Constraint: Squeeze every ounce of performance out of that constraint without spending significant money. If delivery lead time is the constraint, ensure the team has everything they need, are protected from distractions, and are focused only on improving the output from the bottleneck.
- SUBORDINATE Everything Else: This is the most crucial step. Every other part of your business must operate in a way that supports the constraint. The sales team must submit perfect order information. Procurement should ensure parts are available in time & in full kits, Quality should ensure that whatever goes into the constraint & comes out is right first time. The entire system must march to the beat of the constraint’s drum.
- ELEVATE the Constraint: If you’ve exhausted the first three steps and still need more capacity, now you can spend money. Invest in another machine or equipment or infrastructure.
- REPEAT the Process: Once you’ve elevated a constraint, a new bottleneck will appear somewhere else in the system. Go back to Step 1 and start again. This is the engine of continuous improvement.
By applying these steps, you are not just “managing” your cash. You are fundamentally improving the system that generates it. You are increasing your Cash Velocity.
AFTER SCENARIO in INR – (Post implementing solutions):
- Average Inventory: 267 mn
• Cost of Goods Sold (COGS)/ Truly Variable Cost (TVC): 1085 mn
• Average Accounts Receivable: 296 mn
• Total Sales : 1750 mn
• Average Accounts Payable: 224 mn
CCCT metrics:
• Inventory Weeks:
• (267 / 1085) * 52
~ 13 weeks
• Receivable Weeks:
• (296 / 1750) * 52
~ 9 weeks
• Payable Weeks:
• (224 / 1085) * 52
~11 weeks
The Cash to Cash Cycle Time:
• CCCT = Inventory Weeks + Receivable Weeks – Payable Weeks
• CCCT = 13+9-11 weeks
• CCCT = 11 weeks
The Results in 52 weeks:
Cash to Cash Cycle Time (Before implementing solutions) = 23 weeks
Cash to Cash Cycle Time (After implementing solutions) = 11 weeks
Cash Velocity (Before implementing solutions) = 1.82%
Cash Velocity (After implementing solutions) = 4.50%
Cash released by virtue of improvement in Inventory & Receivable turns around INR 35.13 cr
(If the company would have continued their traditional approach, they would have not benefitted from this cash release)
What changed for this company?
- Focus on increasing efficiency of bottleneck instead of every resource
- Daily measurement of throughput & not just sales
- Weekly measurement of CCCT & Cash Velocity
- Implemented a Procurement, Production Planning & Control method to provide utmost clarity on what, when & how much to procure also what, when & how much to produce
- Minimum batch quantity policy abolished
- Daily ordering of raw materials instead of batching – order daily replenishment frequency policy established across supply chain – entire supply chain on real pull
- Significantly reduced order to delivery timeline (almost doubled output from plant)
- Trained key suppliers to manufacture & improve output from bottleneck processes & abolish MOQ, EOQ
- Abolished the process of measuring individual product profit, instead focused on absolute throughput & %age throughput
- Started measuring Available Cash in bank on daily basis
- Categorization & Daily monitoring of cash – Survival, Adequate, Surplus cash
- Established rule to allocate cash to highest cash velocity business line
- Reduced Inventory weeks – implemented inventory & time buffers at plants & supplier, improved speed of bottleneck processes at plants & key suppliers
- Reduced Receivable weeks – better terms negotiated with customers based on reduced delivery lead times & faster new product development
- Negotiated better terms with suppliers by helping them improve their plant output without any investment & payments released intime
- Converted few fixed costs into variable
- Few customers were bought on advance payment terms
- Few decisions taken where counter intuitive to the traditional approach, where-in there was trade off with few customers to reduce credit days in leu of certain discount on selling price, this was done with due consideration of cash velocity.
The Takeaway
Your Cash to Cash Cycle Time is a useful health indicator, like measuring your temperature. But it doesn’t tell you ‘HOW’ to get well. It is necessary but not sufficient. To have a real impact, you need to dive deep & take concrete actions.
If you need the solution on How to increase your Cash Velocity by shifting your focus from the static CCCT number to the dynamic concept of Cash Velocity—driven by Increasing Throughput, Reducing Inventory, Reducing Receivable & Time by achieving Operational & Financial Turnaround, get in touch with us.
Don’t just measure your cash cycle. Unleash its velocity with us.