
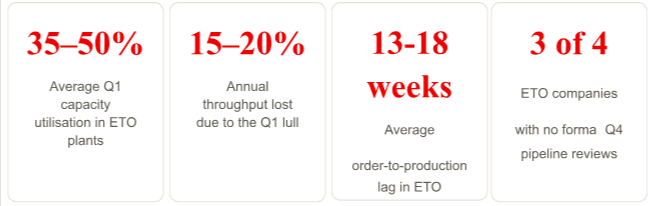
Every year, Engineer-to-Order manufacturers watch their manufacturing floors go quiet just as the financial year begins. It is not bad luck. It is a systemic failure hiding in plain sight — and it starts months before April.
“Walk into any ETO plant in the first week of April and you will find two things: a finance team sweating over the year-end closing and a shop floor that looks suspiciously like a holiday. The machines are there. The people are there. The orders are not.”
If you manufacture custom capital equipment, engineered systems, industrial machinery, or any product where every order is designed from scratch — you are in the Engineer-to-Order (ETO) business. And if you are honest about it, you will admit that the first two to three months of every financial year feel like running uphill in wet sand.
The shop floor utilisation is low. The manufacturing team is waiting. The sales team is recovering from the Q4 sprint. And the leadership team is already worried about whether this year’s numbers will look better than last year’s.
The worst part? This happens every single year. And yet, most companies treat it as an inevitability — a seasonal curse of the ETO business. It is not. It is a self-inflicted wound, and it has a cure.
This article breaks down exactly why this happens, what it costs your business, and — drawing from both best business practices thinking and my practical consulting experience — what world-class ETO companies do differently.
Understanding the ETO Beast
Before we diagnose the problem, let us be clear about what makes ETO companies fundamentally different from make-to-stock or even make-to-order businesses. In an ETO company, the product does not exist until a customer orders it. Engineering, design, procurement, and manufacturing all happen after the order is received.
This creates a critical structural reality: there is no inventory buffer between sales activity and manufacturing load. In a pharmaceutical or FMCG company, you can build up stock during slack periods and run down that stock during demand peaks. In an ETO company, you cannot produce a custom turbine housing “just in case.” Every machine hour is either committed to a live order or it is gone forever.
This is precisely what makes the Q1 lull so devastating — and so preventable. Every idle machine-hour in Q1 is lost throughput. Not deferred. Not rescheduled. Gone.
Key Structural RealityIn ETO manufacturing, idle capacity does not accumulate — it evaporates. An unmanned Laser cutting or bending centre in Q1 is not a cost saved; it is revenue destroyed. This is why the Q1 lull is not a scheduling problem. It is a commercial and strategic failure upstream.
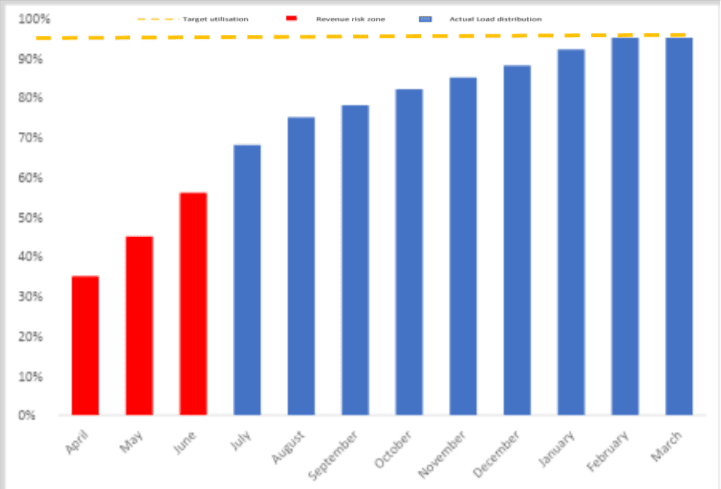
Typical Manufacturing Load Distribution — ETO Company (FY Apr–Mar)
Normalised shop floor utilisation (%) across the financial year. Composite from consulting engagements.
The chart above tells the story with brutal clarity. Q1 (April–June) is a persistent trough. Load climbs through Q2 and Q3, and then the classic year-end sprint pushes Q4 to near-capacity — only to fall off the cliff again come April 1st.
The tragedy is that this pattern looks normal because it repeats every year. What looks normal is actually a recurring financial haemorrhage.
Why Does This Happen? The Root Causes
In my consulting engagements with ETO manufacturers, the pattern is consistent. The Q1 lull is not caused by one thing — it is the convergent result of several systemic failures, most of which originate not in manufacturing but in the commercial organisation and its planning culture. Here are the root causes.
1.Lack of Sales Advance Planning — The Root of the Rot
Ask a sales manager in January what their pipeline looks like for May. The honest answer, more often than not, is: “I haven’t thought that far.” Every neuron in the sales organisation in January-March is focused on one thing — closing deals before March 31st. That is understandable. That is the incentive structure.
But here is the problem. ETO orders don’t convert to manufacturing load the moment they are booked. There is engineering, drawing approvals, customer review cycles, procurement of long-lead-time materials, and only then does the production order hit the shop floor. This full cycle can take eight to eighteen weeks in a typical ETO business.
This means that if your sales team books an order on April 5th, your shop floor will not feel the load until June or July and in some cases even till Sept/Oct— at the earliest. For the shop floor to be loaded in April, the orders needed to be booked in December or January. But in January and February, the sales team was chasing March 31st targets.
From the Consulting Floor
In one of my engagements with a manufacturer of custom material handling systems, the sales team had booked Rs.18 Cr of orders between April 1 and April 15 — they were congratulating themselves on a strong start. But the shop floor utilisation in April was 38%. Why? Because those April orders, after engineering review and customer approval cycles, could only hit production in Sept. The disconnect between when an order is booked and when it creates manufacturing load is almost universally underestimated.
2. No Proactive Sales Management — Running Blind at High Speed
Proactive sales management means actively shaping the order pipeline — not just chasing the orders that walk in. Most ETO sales teams operate reactively. They respond to RFQs, attend to enquiries, and follow up on existing proposals. Very few go out and create demand twelve months ahead.
Proactive sales management for an ETO company means understanding that the real sales cycle is 9–18 months long. The customer’s capex discussion starts eight to twelve months before their purchase order is issued. Even earlier in capital intensive projects. The technical evaluation starts six to eight months before. The budget allocation starts six months before. If your salesperson first hears about the opportunity when the RFQ arrives, you have already missed the relationship-building window.
The result: in April, the enquiry pipeline is thin because nobody was building it six months ago. And nobody was building it six months ago because there is no formal system that requires it.
3. Failure to Meet Customers in the Preceding Financial Year to Understand Next Year’s Projects
This is perhaps the most preventable of all causes — and the one that companies feel most embarrassed about when I point it out. Your best customers are planning their capital expenditure for the next financial year in September through December. By November/December, most of their capex budgets are either confirmed or in the final approval stages.
This is the golden window: September to January. If your sales team is sitting in front of their key accounts in this period — not to sell, but to understand — they would know which machines are being planned, which expansions are coming, which old equipment is due for replacement, and approximately when purchase orders would be issued.
Instead, what happens in October–January in most ETO sales organisations? They are executing deliveries for Q2 orders. Following up on payment receivables. Managing customer complaints. Attending to year-end pressure from their own management. Nobody is asking the customer what they need next year.
Consulting Case Study — Capital Equipment Manufacturing company
How a Simple Customer Visit Protocol Changed April Forever
A custom equipment manufacturing company faced three consecutive years of low utilisation between 38–44% in Q1. Classic lull pattern.
We introduced a structured “Proactive Sales Funnel Management” methodology: every key account (top 15 customers) received a formal visit by a senior salesperson between September and December, specifically with the agenda of understanding the customer’s next financial year capital plan. No selling. Just listening and mapping.
The output was a forward demand calendar — what projects are likely, approximate value, likely timing of PO. Within two cycles, the company was entering April with 60–65% of its Q1 target already in confirmed backlog. Shop floor utilisation in Q1 improved from 41% to ~70%. April & May alone added ₹16 Cr in throughput that would otherwise have been lost.
The cost of the program? Sixteen structured customer visits per year. The return? Permanent structural improvement in Q1 performance.
4. Quarter-End Syndrome Carryover — When March Eats April
I have written about Quarter-End Syndrome before — the distorted, unsustainable sprint that organisations run in the last few weeks of every quarter, and especially in March. The ETO company’s version of this syndrome has a particularly nasty effect on April.
In Feb/March, the sales team is offering unplanned discounts and extended payment terms to pull orders forward. The operations team is running overtime, skipping preventive maintenance, and deferring non-urgent work to hit delivery commitments. The engineering team is shortcutting documentation. Everyone is in emergency mode.
Then April 1st arrives. Sales targets reset to zero. The urgency evaporates. The team that just ran a marathon stops suddenly. Sales velocity crashes. And all that deferred maintenance, documentation backlog, and organisational exhaustion creates a quiet hangover in April. The shop floor is not just empty of orders — it is also operating at sub-optimal efficiency because of the fatigue carried forward from March.
5. Poor Cross-Functional Visibility — Everyone Knows Their Own Piece, Nobody Sees the Whole
In most ETO companies I have worked with, the sales team knows its pipeline. The engineering team knows its workload. The procurement team knows its supplier lead times (although not really). Production knows its current shop orders. But none of these teams have shared, real-time visibility of the end-to-end picture.
This creates a predictable failure: by the time manufacturing starts seeing thin April loading in the weekly shop floor review, it is already too late. The orders that would have prevented this situation needed to be identified and committed four to six months earlier. But because nobody was aggregating the signals — sales pipeline + engineering queue + procurement lead times + production capacity — the warning was never raised.
Cross-functional visibility is not just a technology problem (though ERP and CRM systems help). It is fundamentally a meeting rhythm and accountability problem. If your organisation does not have a monthly Sales and Operations Planning (S&OP) process that forces a conversation about 12-month demand visibility, you are flying blind — and you will be surprised by the Q1 lull every year.
6. Long Order-to-Production Cycle — The Structural Amplifier
ETO companies have inherently long lead times between order booking and production start. Engineering drawings must be made. Customer approval must be obtained. Bought-out components must be ordered (sometimes with 10–18 week supplier lead times). Only then can the job card hit the shop floor.
This structural lag amplifies every upstream failure. A reactive sales organisation that only starts booking April orders in March does not get a four-week gap in manufacturing load — it gets more than twelve-week gap. The lag transforms a small commercial planning failure into a large operational crisis.
The companies that manage this well understand that the engineering and procurement clock starts the moment a high-probability order is identified — not when the PO is received. They align project priorities, begin preliminary engineering, do provisional reservations with suppliers, and do advance procurement planning on the basis of order probability. This is not always possible, but it is far more common in world-class ETO firms than in typical ones.
7. Customer Budget Cycle Misalignment — The External Reality
There is an external dimension that is often underappreciated. Many of the customers that ETO manufacturers serve — large manufacturing corporations, infrastructure companies, public sector undertakings, large MSMEs — operate on similar April–March financial years. Their capex approval processes are often completed in February or March. Purchase orders are issued after internal approvals, which can take 4–6 weeks post budget finalisation.
This means that a customer whose capex budget is approved on March 20th may issue the PO on April 25th. The ETO manufacturer receives the PO in late April. Engineering begins in May. Production starts in July/August or even later. This is normal, legitimate business — but it means that the structural floor of the Q1 lull is partly set by how your customers’ procurement processes work.
The mitigation is not to fight this reality but to build relationships early enough that you are receiving Letters of Intent, advance work orders, or even preliminary engineering orders before the formal PO — so that your cycle can start earlier.
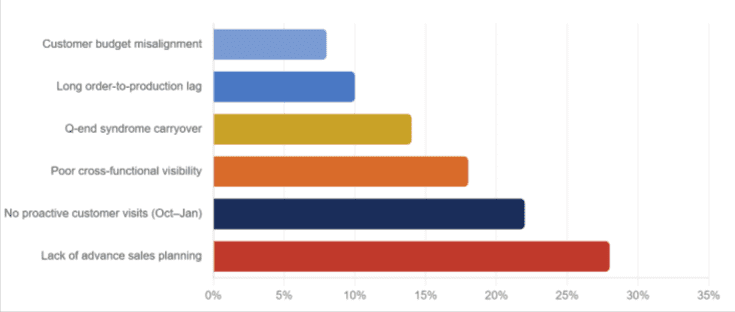
Root Cause Impact on Q1 Manufacturing Load Deficit
Estimated contribution of each root cause to the Q1 load gap (% of total gap). Based on consulting diagnostics.
Where Is the Constraint in Q1?
For most of the financial year — Q2 through Q4 — the constraint in an ETO company is internal: it is a process, a skilled workforce, an engineering department, a testing facility. The goal of management during these months is to exploit and protect that constraint: keep it busy, subordinate everything else to feeding it, and elevate it when possible.
In Q1, the constraint shifts. The shop floor is not the constraint. Engineering is not the constraint. The real constraint is order intake — the market itself. The bottleneck is not inside the factory; it is outside, in the sales pipeline.
Q2–Q4: Internal Constraint
The constraint gradually shifts from sales to engineering to manufacturing as Q4 approaches its end. Management must protect the critical resource — whether it is the engineering team, CNC machining centre or a welding bay. The goal is maximum exploitation of internal capacity.
Q1: External Constraint
The constraint is the market — specifically, the absence of confirmed orders. No amount of shop floor efficiency helps here. The only way to exploit the constraint is to have built the pipeline months earlier, before Q1 began.
The Response
Step 1 is to identify the constraint. Most ETO companies never identify that their Q1 constraint is commercial, not operational — so they never address it at the right level. They try to “improve efficiency” when there is nothing to be efficient with.
Throughput Accounting View
(Throughput – Sales -Truly Variable Cost)
Every idle hour in Q1 is destroyed throughput — T (Throughput) falls while OE (Operating Expenses) stays constant. The result is a direct hit to net profit that cannot be recovered. This is not a recoverable variance; it is a permanent loss.
I would like to point out the concept of “Buffer Management”. In an ETO environment, the “buffer” that protects the shop floor from starvation is not a material buffer — it is an order pipeline buffer, it is engineering drawings buffer A healthy ETO company should, at any point in the year, have a 13–16 week confirmed backlog sitting ahead of the constraint resource. If this buffer is thin in March, the shop floor will be starved in April–May.
The prescriptive response: subordinate all commercial activities to feeding the order backlog buffer. This means the sales organisation must be measured and managed not just on bookings in the current month, but on the 12-week forward backlog health — especially heading into the new financial year.
Cumulative Throughput Loss — The Cost of the Q1 Lull
Illustrative Throughput trajectory for a ~Rs.350 Cr revenue ETO company. The Q1 gap creates a deficit that is never fully recovered.
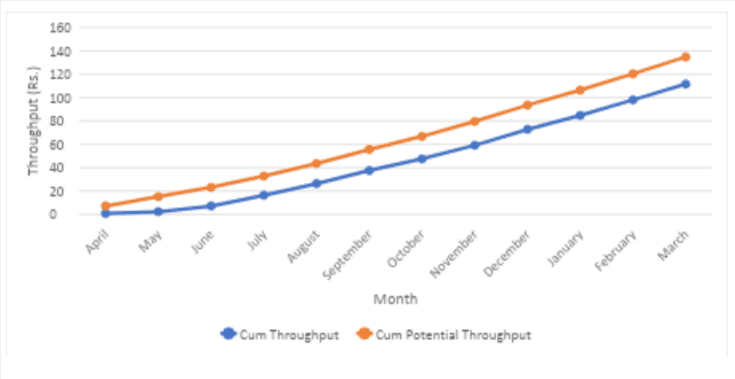
Illustrative model. Rs. values representative of a mid-size ETO manufacturer with ~Rs.350 Cr annual revenue. Actual gap will vary by company.
What World-Class ETO Companies Do Differently
The companies that have cracked this problem are not doing magic. They have simply institutionalised a set of commercial and planning disciplines that most companies know about but very few actually practise consistently. Here is the direction of solution.
“Proactive Sales Funnel Management Program” — Sept to Jan Customer Visits:
Every key account (top 15–20 customers by revenue) should receive a structured “next year planning” visit between September and January. The agenda is simple: what capital investments is your business planning for next year? What problems are you trying to solve? What equipment is coming up for replacement? This intelligence, systematically collected and entered into a demand calendar, is transformative for Q1 load planning.
12-Month Rolling Sales Pipeline Review
Replace the monthly “what did we book this month” review with a rolling 12-month pipeline review. Sales must be able to show the probability-weighted order pipeline for every month through the next 12. When this data is shared with operations and engineering in a monthly S&OP meeting, the Q1 starvation signal is visible by October — in time to do something about it.
S&OP Process with Cross-Functional Discipline
A monthly Sales and Operations Planning meeting that brings together Sales, Engineering, Procurement, and Production to review the 12-week forward demand picture. This is the single most important structural intervention. Without it, each function optimises locally and nobody sees the systemic gap until it is too late.
Advance PO / LOI / Preliminary Engineering Orders
Train and empower the sales team to negotiate Letters of Intent or Preliminary Engineering Orders from high-probability opportunities, especially where the full PO will take time due to customer approvals. Even a small preliminary engineering order allows the ETO company to begin drawing preparation, customer approval processes, and provisional procurement — compressing the eventual production timeline by 5–7 weeks.
Aligned Sales Metrics — Measure Forward Backlog, Not Just Current Bookings
Add a key metric to the sales dashboard: 13 week confirmed order backlog for each engineering division or plant. If this number drops below a defined threshold heading into Q4, it triggers an automatic sales escalation process. The constraint is now visible, measured, and managed — rather than discovered after the damage is done.
Salespeople on Structured Call Plans, Not Just Enquiry Responses
Define a minimum number of “next-year planning” calls particularly visits per salesperson per quarter. Track it. Review it. Make proactive customer engagement a KPI alongside bookings. A salesperson who only responds to RFQs is doing customer service, not sales. True value-creating sales in ETO is a consultative, forward-looking activity — and it must be managed as such.
Benchmarking: Where Does Your Company Stand?
Here is a quick diagnostic framework. Measure where your organisation sits today across these five dimensions:
| Dimension | Reactive (Below Par) | Average | Required |
| Q1 Capacity Utilisation | < 70% | 70–80% | > 80% |
| Forward Order Buffer (weeks) | 0–10 weeks at April 1 | 10–15 weeks | 15-20 weeks |
| Customer Visits in Sept–Jan (per key account. Depnds on no of cust rep & cust) | <2 | 3-4(reactive) | 4+ (structured) |
| S&OP Process | None / ad hoc | Quarterly review | Monthly/Weekly, 12-month rolling, 13 week MAV |
| Sales Pipeline Visibility (months ahead) | 1–2 months | 3–4 months | 6–12 months |
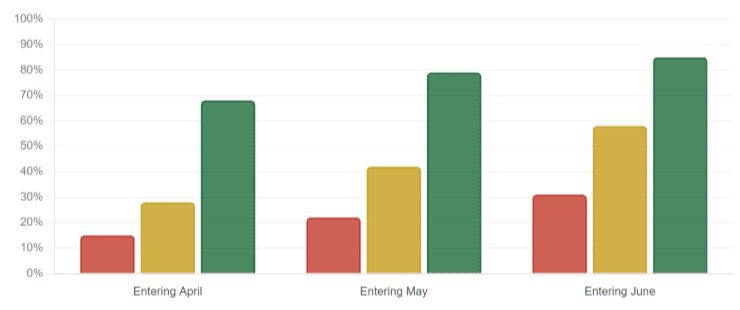
Percentage of Q1 manufacturing load covered by confirmed backlog on April 1st. Data from few Consulting engagements.
Values represent confirmed + high-probability order coverage as a percentage of monthly capacity.
Consulting Case Study — Material Handling Equipment Manufacturing Company
“We Can’t Control When Our Customers Place Orders” — and Why That’s Wrong
This is the most common pushback I hear. And it is understandable — because it feels true. But it confuses two separate questions: you cannot control when the customer will issue a PO, but you can absolutely influence when their project gets initiated, specified, and budgeted — and that is where the real leverage is.
A capital equipment OEM had a classic April, May lull problem. When I interviewed their key accounts, I found that three of their top five customers had active projects they were planning for next year — but hadn’t approached the OEM yet because they “didn’t want to commit too early.” In two of those cases, they ended up giving the business to a competitor who had proactively called on them in November.
The OEM had lost two large orders not because they were not capable, but because they were not present. We introduced a structured “Key Account Future-Planning Calendar” — basically a simple process requiring each sales manager to schedule at least one forward-looking meeting per key account between September and January. Within eighteen months, the company’s confirmed April demand went from Rs.8 Cr to Rs.15 Cr. Q1 utilisation improved from 42% to 71%. The ROI on those eighteen structured visits was extraordinary.
Let’s Talk Numbers: What the April Lull Actually Costs
The financial impact of Q1 underutilisation is almost always underestimated because it is diffuse — it does not show up as a line item in the P&L. But let us do the arithmetic for a representative ETO company.
Illustrative Throughput Loss Calculation
Company profile: ETO manufacturer, Rs.350 Cr annual revenue, Rs.140 Cr throughput (T = Revenue minus Totally Variable Cost), ~300 working days.
Daily throughput potential: 140 Cr ÷ 300 = ~Rs.46 lakhs/day
Q1 (78 working days) at 45% utilisation vs. 90% target: 45% capacity gap × Rs.46 lakhs × 78 days = ~Rs.16.15 Cr in destroyed throughput
Operating expenses remain fixed throughout: So every rupee of lost throughput drops straight to the bottom line. The April lull costs this company approximately Rs.15 to 16 Cr in net profit — every single year. Permanently.
That Rs.16 Cr is not a one-time loss. It repeats year after year because the root causes are never addressed. Over a five-year period, a single ETO company of this size is quietly destroying Rs.80 Cr in profit through the Q1 lull alone. This is not small money. This is the difference between a company that grows and one that stagnates.
The Bottom Line: April Is Won in September/October
The April lull in ETO companies is not a mystery. It is not bad luck. It is not an unavoidable feature of the business model. It is the predictable consequence of a commercial organisation that plans one quarter at a time, manages relationships reactively, and never looks beyond the current year-end.
The fix is equally clear. It requires discipline, not complexity. Meet your key customers in September through January — not to sell, but to understand. Build a rolling 12-month pipeline that your engineering & manufacturing team can plan against. Run a monthly S&OP process that forces sales, engineering and production to have an honest conversation about the forward demand picture. Measure the 16 to 18-week confirmed order horizon as a leading indicator of engineering & shop floor health.
Most of all, recognise the fundamental insight: in Q1, your constraint is not on the shop floor. It is in the market. And the time to address a market constraint is not April. It is the September/October before it.
April is won in September/October. The companies that understand this are the ones with 85%+ Q1 utilisation while their competitors are staring at idle machines and wondering why business is slow. They are not smarter. They are simply earlier.
If you are facing similar challenges in your company and looking for a solution you may reach out to me on: