Most manufacturers instinctively reach for the cost-cutting drive. It’s often the wrong approach — and the numbers prove it.
I walked into a mid-sized auto-component manufacturer. Their MD had a confident plan: cut operating costs by Rs.20 Cr annually. He’d identified bloated utility bills, excess headcount in departments, and an expensive capital expense. The plan looked solid on paper.
I asked him one question:
“What’s your current on-time delivery rate to your OEM customer?”
It was 72%.
That OEM was quietly evaluating a second source. The revenue at risk was ~Rs. 75 Cr per year.
We shelved the cost plan. We fixed the line first. Eighteen months later, OTD was at 96%, the OEM dropped their second-source evaluation, and volumes grew 22%. The Rs.20 Cr cost cut they’d planned? It happened naturally as a byproduct of smoother operations — without a single layoff.
This tension between cost reduction and throughput improvement is one of the most consequential decisions leaders make. And most of them get it wrong — not because they’re bad managers, but because cost data is visible, while throughput opportunity is invisible.
Let’s Define the Terms Properly
| Throughput (T) — The rate at which the system generates money through sales. It’s essentially Revenue minus Truly Variable Costs (raw materials). Think of it as the money that flows in.Operating Expense (OE) — All the money spent to run the system: wages, rent, utilities, depreciation. The money that flows out.Inventory / Investment (I) — All the money the system has locked in things it intends to sell. Work-in-process, raw materials, finished goods. |
Net Profit in this framework is simply: T − OE. Return on Investment is: (T − OE) / I.
Now here’s the critical asymmetry: Cost reduction has a floor. Throughput has no ceiling.
You cannot cut costs below zero. But you can — almost always — sell more, produce more, and deliver faster if you know where the system is being strangled.
The Math That Changes Everything
Let me show you a calculation that I use in almost every initial diagnostic with manufacturing clients
Consider a manufacturing company — let’s call them Company M — with these baseline numbers
| Parameter | Value |
| Monthly Revenue | ₹32,00,00,000 |
| Raw Material Cost (Variable) | ₹17,60,00,000 (55%) |
| Throughput (T) | ₹14,40,,00,000 |
| Operating Expenses (OE) | ₹12,45,00,000 |
| Net Profit | ₹1,95,00,000 |
| Net Profit Margin | 6% |
Now, management presents two proposals at their board meeting:
Option A — Cost Reduction: An aggressive renegotiation on Capital expenses + energy audit + minor headcount restructuring. Expected savings: Rs.25 lakh / month. High confidence. 6-month implementation.
Option B — Throughput Improvement: Identify and debottleneck the constraint process (a CNC machining centre running at 98% utilisation). Adding a second weekend shift + minor tooling investment could increase output by 12%, which market demand can readily absorb.
Let’s run the numbers side by side:
| Metric | Baseline | Option A: Cost Cut | Option B: Throughput |
| Revenue | Rs.32 Cr | Rs.32 Cr | Rs.35.84 (+12%) |
| Variable Costs | Rs.17.60 Cr | Rs.17.60 Cr | Rs.19.71 (+12%) |
| Throughput | Rs.14.40 Cr | Rs.14.40 Cr | Rs.16.12 |
| Operating Expenses | Rs.12.45 Cr | Rs.12.20 Cr | Rs.13.50 (+shift cost) |
| Net Profit | Rs.1.95 Cr | Rs.2.20 Cr | Rs.2.63 Cr |
| Profit Improvement | — | +Rs.25 L / month | +Rs.68 L / month |
| % Improvement | — | +12.80% | +35% |
| THE INSIGHTOption A improves profit by Rs.25L. Option B improves profit by Rs.68L per month — nearly 2X more — even after accounting for the additional operating cost of the new shift. The throughput play wins because every additional rupee of throughput drops straight to the bottom line, while cost cuts are bounded.And yet — in my experience — 9 out of 10 leadership teams would have chosen Option A. It feels safer. It’s more predictable. And it doesn’t require them to sell more. |
The Bottleneck: Where the Money Is Being Strangled
Every system has one constraint that limits its throughput. In a manufacturing line, this is the bottleneck — the slowest station that determines the pace of the entire system. Improving anything else is waste.
| Turning60 pcs/hrUtil: 58% | Milling55 pcs/hrUtil: 63% | ⚡ CNC BOTTLENECK35 pcs/hrUtil: 98% 🔴 | Grinding50 pcs/hrUtil: 70% | Inspection45 pcs/hrUtil: 78% |
| Steps: first, identify the constraint. Then exploit it — squeeze every last unit of capacity from what you already have. Eliminate setup time, reduce changeovers, eliminate downtime at the bottleneck. Only after exploiting it should you elevate it (invest in more capacity). Subordinate everything else to this decision.In the diagram above, reducing manpower at the Turning station (a cost-cutting move) would save perhaps Rs.3,00,000/month. Eliminating 1 hour of daily unplanned downtime at the CNC bottleneck — at 35 pcs/hr and Rs.7800 throughput per piece — recovers Rs.68 lakh per month. |
From the Field: When Cost Cuts Backfired
| CLIENT STORY · FORGINGS MANUFACTURER The Annealing Furnace DecisionA mid-size forging company was under pressure from their promoter to show margin improvement. The operations head proposed shutting down one of three annealing furnaces — it appeared to be ‘underutilised’ at 55% capacity. Annual saving: approximately Rs.28 lakh in energy and maintenance.When I mapped their production flow, I discovered something the utilisation report couldn’t show: that furnace was the buffer for their most profitable product line — a high-mix, low-volume critical application forging that required specific heat treatment cycles unavailable on the other furnaces.Shutting it down would have forced them to outsource that heat treatment at Rs.42 lakh per year — a net negative of Rs.14 lakh — while also increasing lead time from 12 to 21 days, putting a key OEM contract at risk.We preserved the furnace. Instead, we identified an upstream hammer that was the real bottleneck, reduced its changeover time by 38% using SMED principles, and increased throughput by 14% in four months. The resulting profit improvement was ₹31 lakh annually — more than the cost cut they’d been chasing. |
| CLIENT STORY · SHEET METAL FABRICATIONThe Night Shift They StoppedAnother client — a sheet metal fabricator supplying HVAC and electrical enclosures — eliminated their night shift as a cost measure. Saving: Rs.18 lakh annually in wages and overheads.Three months later, their laser cutting machine (the bottleneck) was now idle for 10 hours every day. Cycle times to customers extended. One customer moved to a competitor. Lost revenue: Rs.90 lakh per year.The calculation is simple but brutal: their laser cutter processed material worth Rs.2,200 in throughput per hour. Idling it for 10 hours a day, 250 days a year means Rs.5.5 Cr in throughput walked out the door to chase Rs.18 lakh in savings. We helped them restart the night shift within the quarter. |
Three Questions to Ask Yourself
| Question | YES Answer | NO Answer | ||
| Q1: Does this action increase Throughput (T)? | Priority — pursue it. Highest leverage. | Move to Q2/Q3. Does not directly grow money. | ||
| Q2: Does it reduce Operating Expense (OE)? | Good — but verify no T impact. Proceed. | Move to Q3. Reconsider total impact. | ||
| Q3: Does it reduce Inventory / Investment (I)? | Helps cash flow. Lowest priority. | Do not proceed. No benefit to system. |
Notice the order. Rank Throughput improvement above cost reduction. For most manufacturing companies operating below full capacity, there is significantly more money available in selling what you can already make than in reducing what you spend to make it.
So, When Should You Cut Costs?
I want to be balanced here. There are conditions where cost reduction is the right call. The decision framework I use with clients:
| Situation | Priority | Reasoning |
| Market demand exceeds current capacity | Throughput First | Every rupee invested in removing the bottleneck pays back via more sales |
| Operating at survival-level margins, negative cash flow | Cut Cost, Conserve Cash, Generate Cash | Survival requires stopping the cash bleed before growth |
| Identified waste that does not impact the constraint | Both, Parallel | Non-constraint waste reduction frees bandwidth for throughput focus |
| Demand is stagnant; market is price-competitive | Cost Competitiveness | Margin improvement via OE reduction is the lever available |
| Overheads have grown disproportionate to revenue | Structural Reset | Right-sizing the fixed cost base before the next growth phase |
| New product line / market entry being planned | Throughput First | Build the revenue engine before optimising the cost engine |
The Compounding Asymmetry Over 3 Years
Here’s what makes the throughput argument even more compelling when you extend the time horizon. Cost savings are largely one-time events — you cut a contract, you save X. Throughput improvements, if they capture market share and customer loyalty, compound.
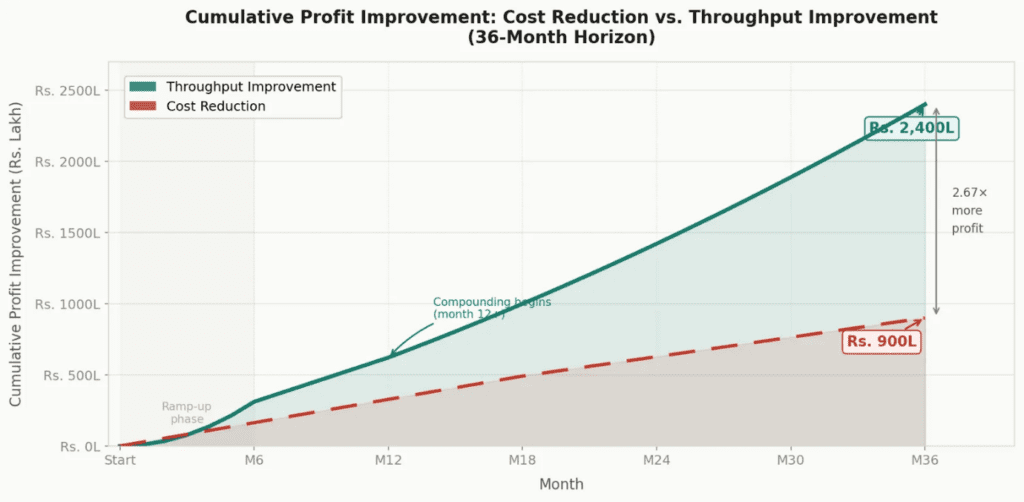
Cumulative profit improvement — Cost Reduction vs. Throughput Improvement over 36 months. Throughput compounds as customer confidence grows and volumes increase. Cost savings plateau.
|
THE HIDDEN COST OF COST CUTTING What rarely appears in cost-reduction business cases: the morale tax, the talent attrition risk, and the customer perception damage. When manufacturers lay off workers, reduce shifts, or cut supplier quality standards, customers notice. Lead times stretch. Quality dips.The savings appear in month one; the losses arrive in months 6 through 18 — and nobody connects the dots.I’ve seen many companies who lost a significant customer relationship within 18 months of an aggressive cost-cutting programme. None of them attributed the customer loss to the cost cuts. They blamed market conditions. |
|
The Bottom Line Cost reduction is a legitimate tool. But it is not a strategy. In manufacturing, where the difference between a great and a poor performing company is often a single bottleneck process, a single delivery metric, or a single customer relationship — the leverage of throughput improvement almost always dominates.If you measure your operations managers only on cost, they will cut. If you measure them on throughput, customer delivery, and constraint utilisation — they will build.Build the revenue engine first. Optimise it second. |